Election Commission of Pakistan has published the Final Electoral Rolls 2012, which includes 84.36 million voters on 31 July, 2012. FER List contains names of eligible voters who are at least 18 years old and have got CNIC. You can check that either your name is registered as voter or not, via SMS. And if you found that your name is not enlisted as voter, you can apply for it by visiting your local District Election Commissioner Office. Visit following post for details:
Election Commission has appealed citizens, political parties and media to check voters' details and apply for any correction if required. People can change their constituency area or make any other correction before the announcement of general elections.
People who attained minimum age limit of 18 years after May 2012, can also get registered as voter till the announcement of elections. If your name is not enrolled in FER, you can submit application to District Election Commissioner/ Registration Officer or Assistant Registration Officer. You can find the name, address and telephone number of ECP Representative in your district from following web address:
People who attained minimum age limit of 18 years after May 2012, can also get registered as voter till the announcement of elections. If your name is not enrolled in FER, you can submit application to District Election Commissioner/ Registration Officer or Assistant Registration Officer. You can find the name, address and telephone number of ECP Representative in your district from following web address:
http://ecp.gov.pk/Contactus/ListofDECAEC.aspx
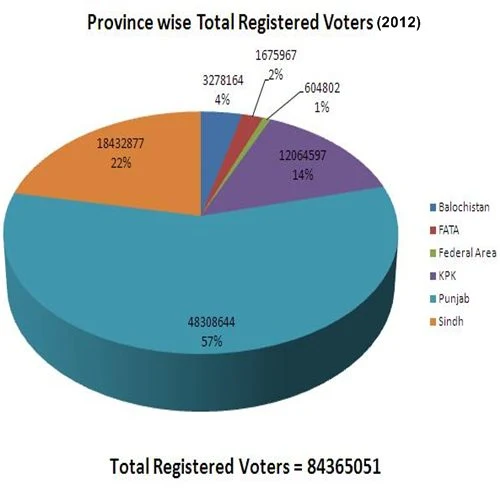
Final Voter Statistics upto July, 2012
According to FER (Final Electoral Rolls) 2012, there are 84.36 million registered voters in Pakistan. Among these 47.77 million (56.6%) are male while 36.59 millions (43.4%) are female voters.
 |
| Province-wise Voters in Pakistan |
Here is province/ territory wise breakdown of male and female voters.
Province
|
Male
|
Female
|
Total
|
Balochistan
|
1,886,235
|
1,391,929
|
3,278,164
|
FATA
|
1,120,736
|
555,231
|
1,675,967
|
Federal Area
|
325,795
|
279,007
|
604,802
|
KPK
|
6,929,105
|
5,135,492
|
12,064,597
|
Punjab
|
27,297,361
|
21,011,283
|
48,308,644
|
Sindh
|
10,214,460
|
8,218,417
|
18,432,877
|
Total
|
47,773,692
|
36,591,359
|
84,365,051
|
See following table for age-wise distribution of voters.
Age Groups
|
Voters
|
18-25 years
|
16.2 million
|
26-35 years
|
23.8 million
|
36-45 years
|
17.0 million
|
46-55 years
|
11.9 million
|
56-65 years
|
8.4 million
|
Above 65 years
|
6.7 million
|
Tags
ECP
Election Commission of Pakistan
Elections
Elections 2013
FER
Politics
Vote
Voter Stats
Voters
